Convert Image to Excel Table: Extract Rows and Columns from Photos and Screenshots
Learn how to convert an image to an Excel table from photos, screenshots, scanned documents, invoices, inventory sheets, and bank statements using OCR.
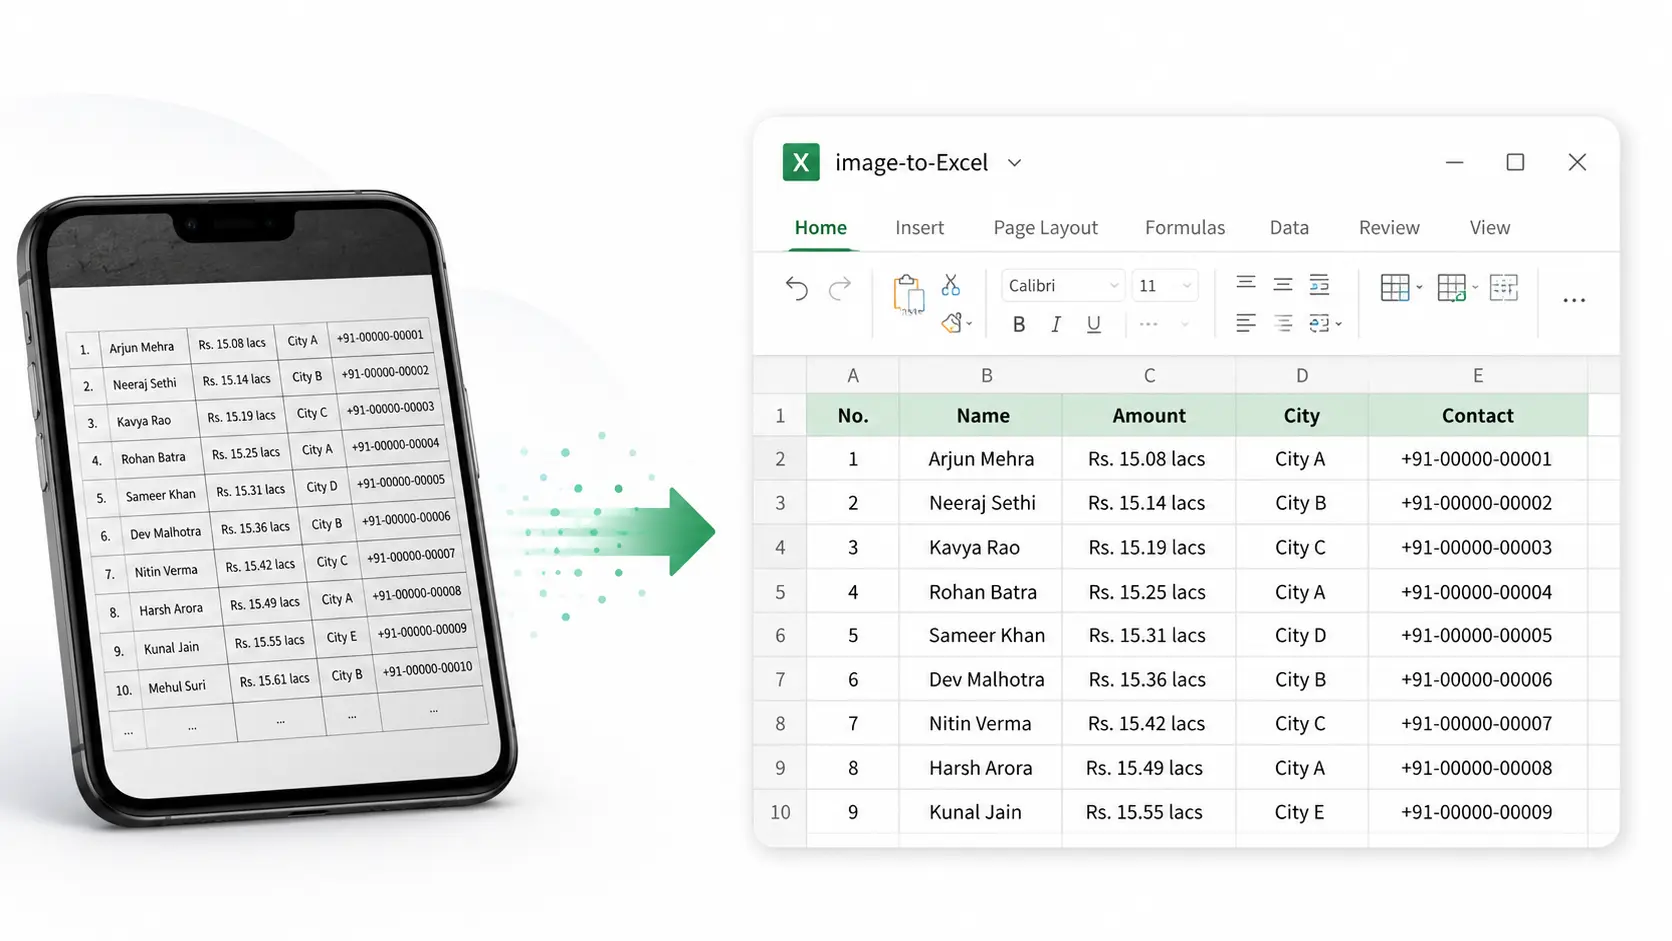
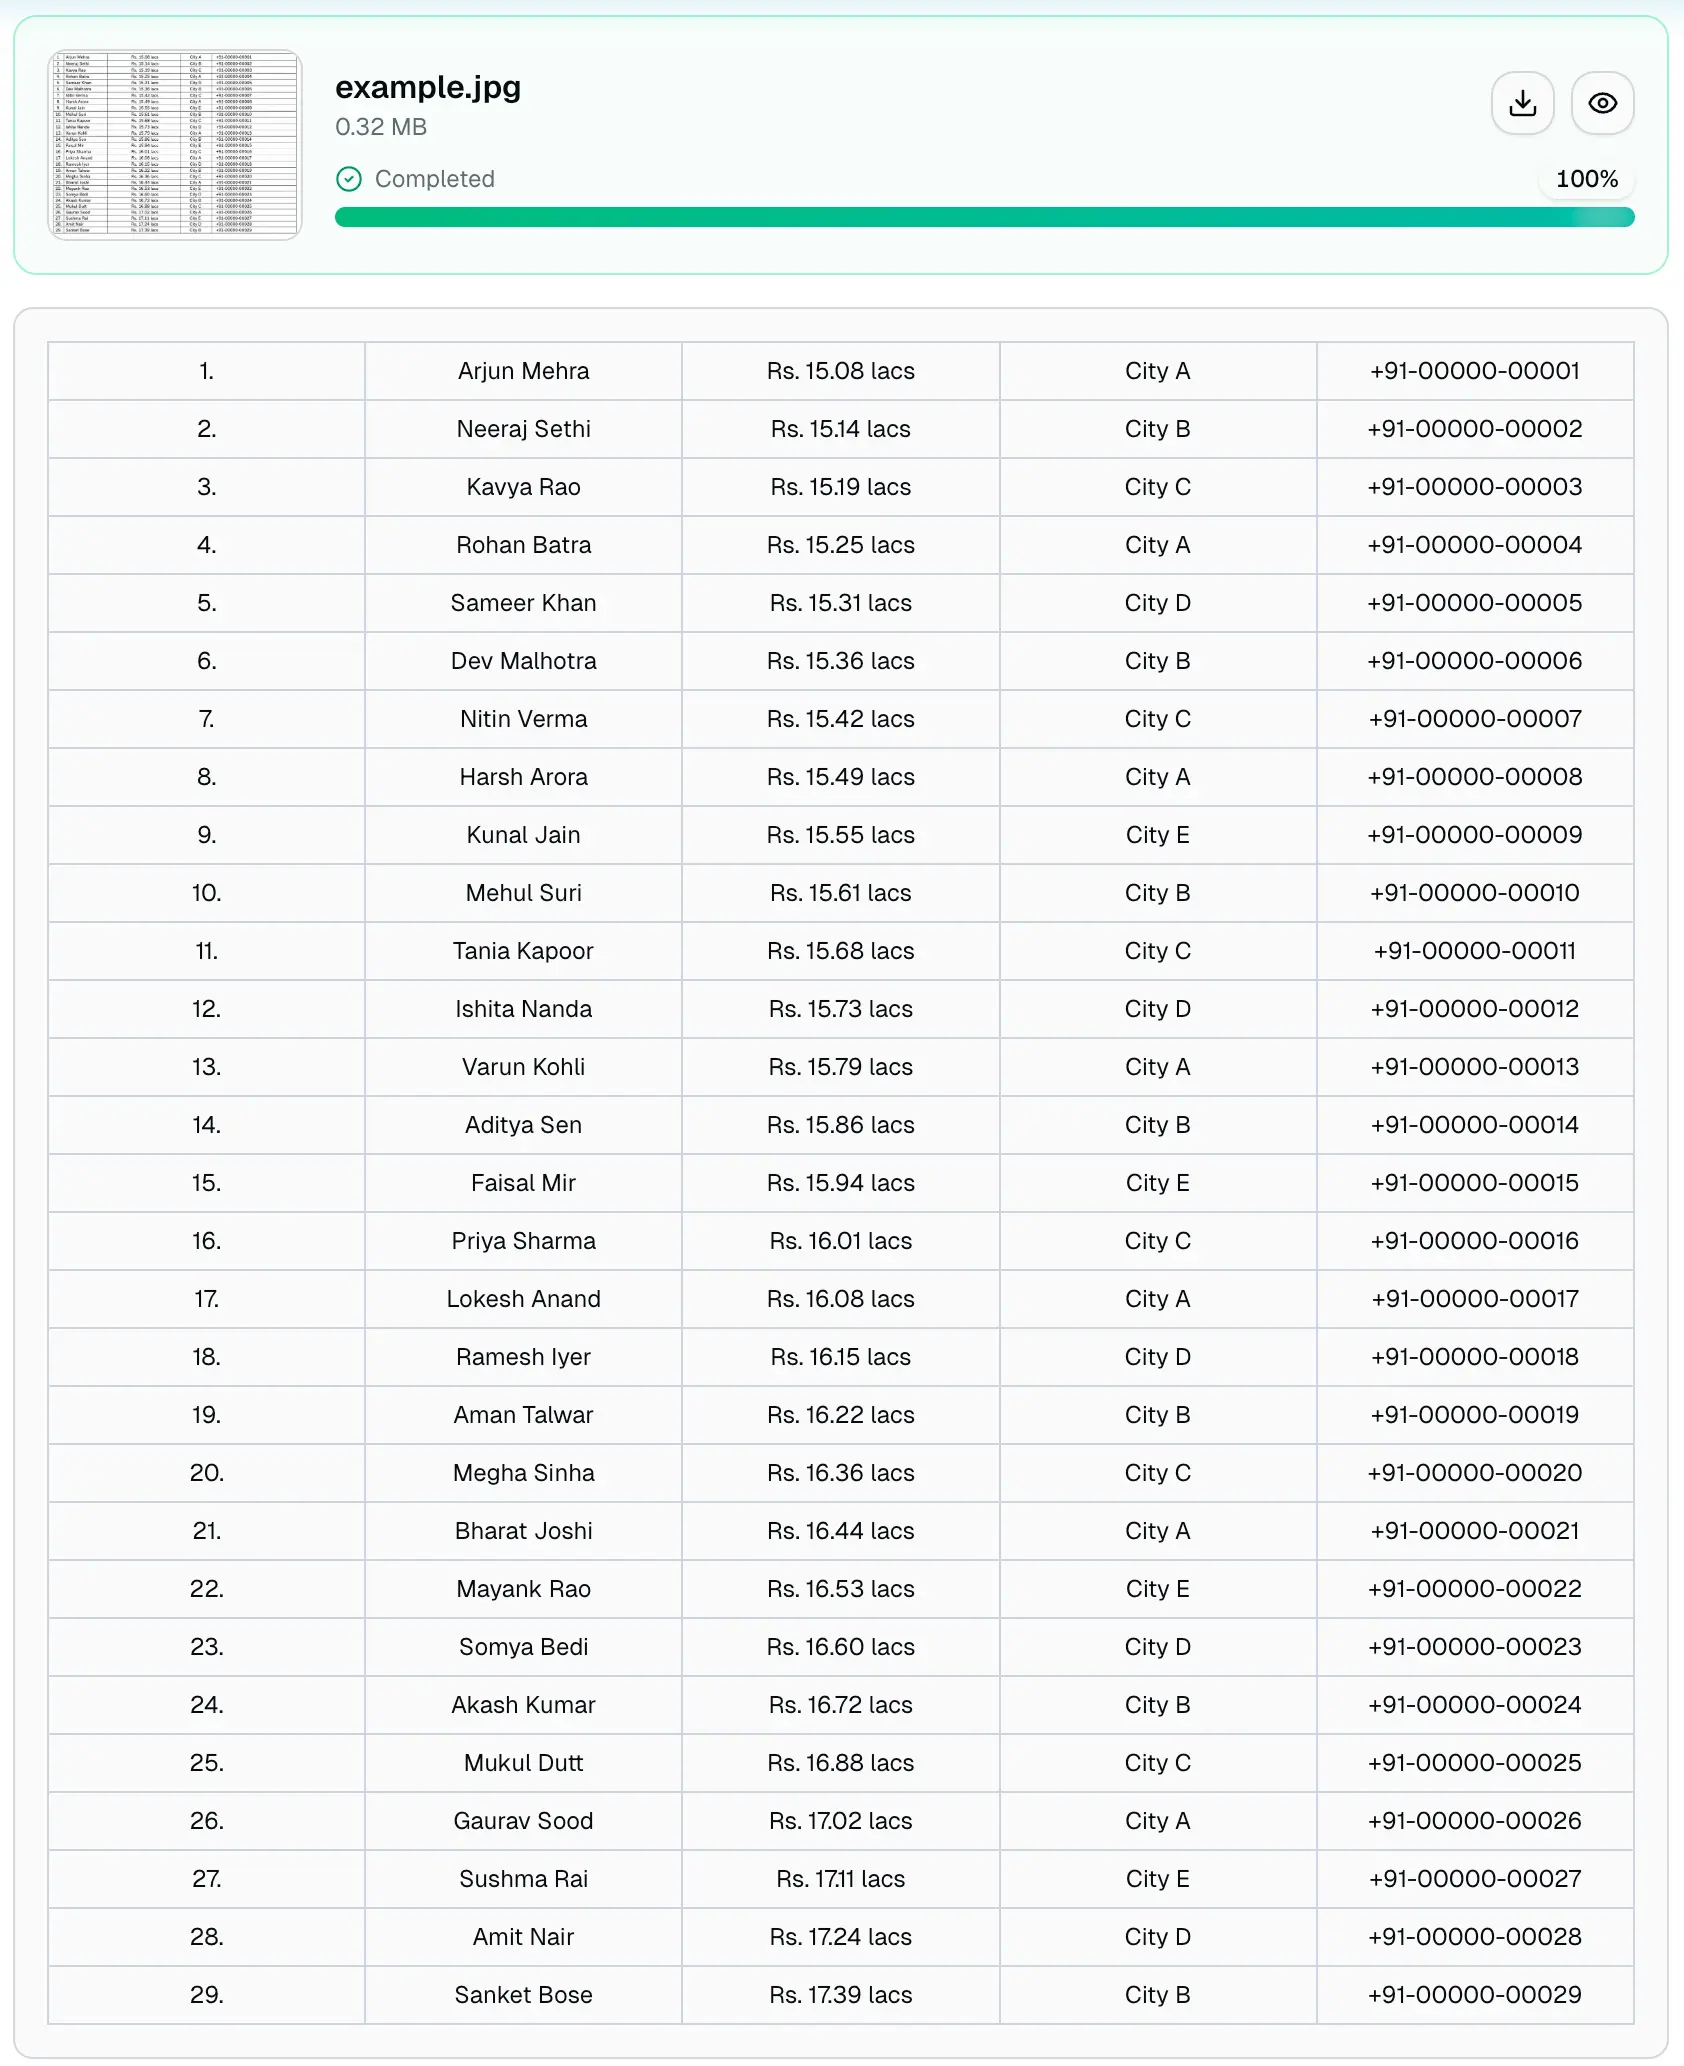
If you have ever received a table as a JPG, PNG, screenshot, scanned document, or WhatsApp photo, you know the problem: the information is visible, but it is trapped inside an image. You can read the rows and columns, but you cannot sort, filter, calculate, clean, or copy the data without typing everything again.
An image to Excel table converter solves that problem by using OCR to detect the table structure inside the image and turn it into an editable Excel or XLSX spreadsheet. Instead of pasting a flat picture into Excel, the goal is to extract real cells: headers, rows, columns, dates, quantities, IDs, prices, and totals.
This guide explains how image-to-table conversion works, which kinds of images convert best, what to check before using the output, and how to avoid common OCR mistakes. If your source is a phone camera image, you can also use the dedicated convert a photo of a table to Excel tool page.
If your source file is a JPG table image, follow the how to convert JPG to Excel guide.
What does "image to Excel table" mean?
Converting an image to an Excel table does not mean inserting a picture into a spreadsheet. It means extracting the table data from an image and rebuilding it as editable spreadsheet cells.
For example, a photo of an invoice might contain columns like:
- Item
- Barcode
- Description
- Quantity
- Unit price
- Amount
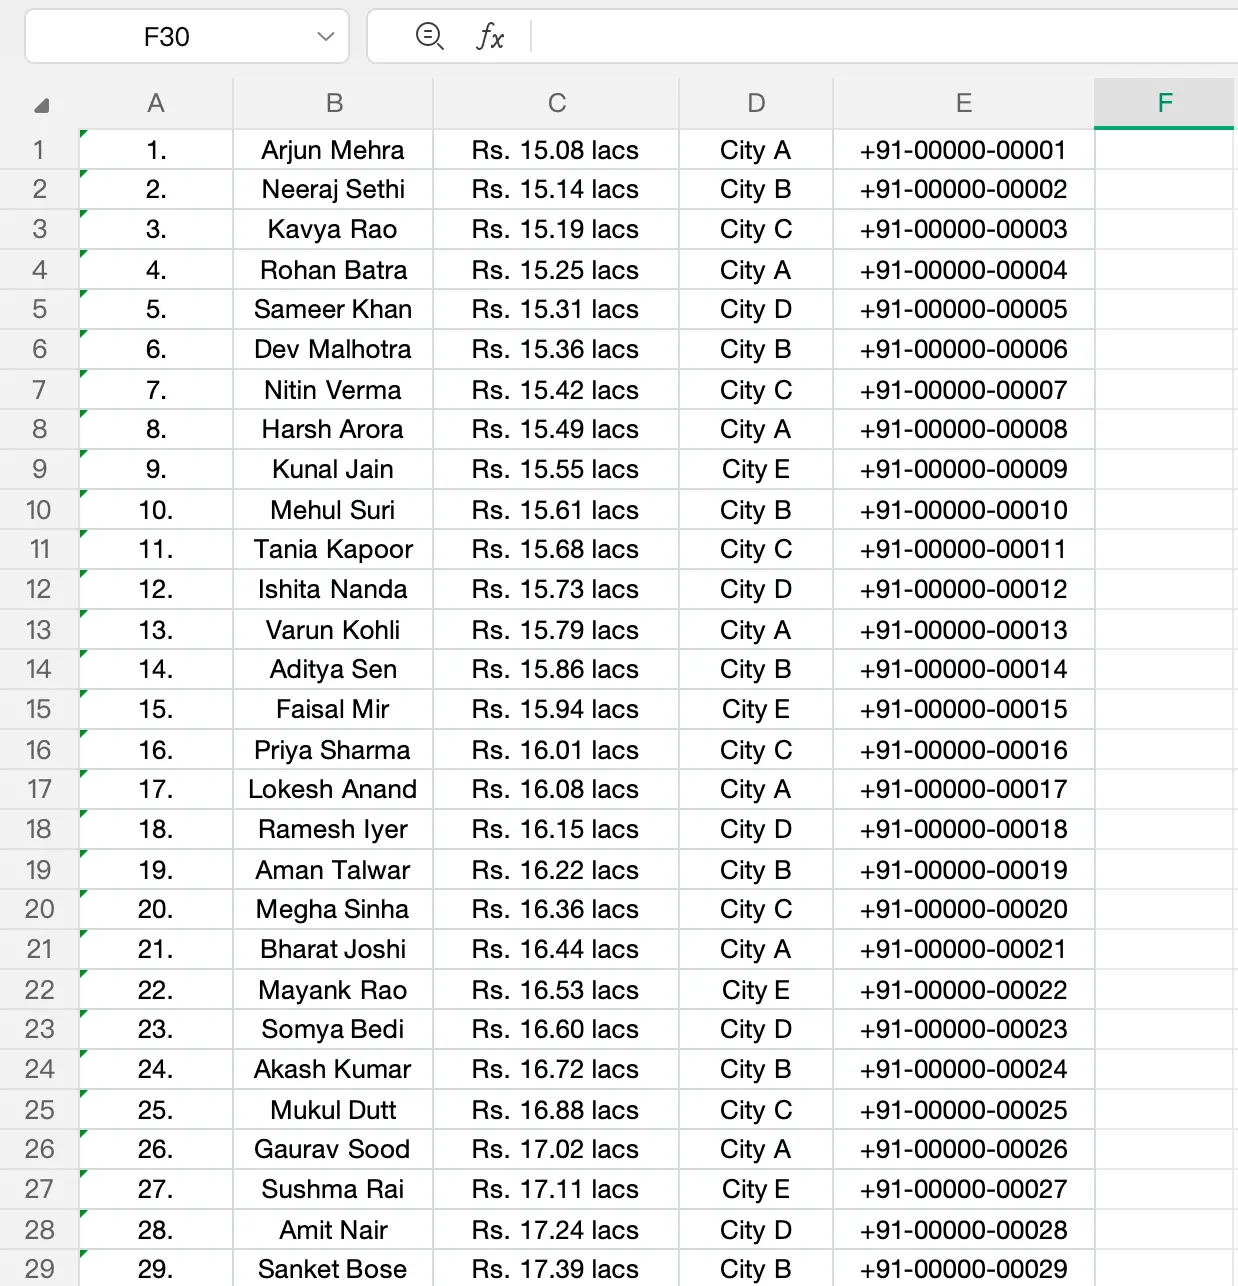
After conversion, those columns should become Excel columns. Each product line should become a row. The exported XLSX file can then be opened in Microsoft Excel, Google Sheets, Numbers, or compatible spreadsheet software.
This is useful when the source file is not available as a spreadsheet. Many teams only receive tables as screenshots, phone photos, scans, exported PDF pages, or chat images. OCR gives you a practical way to recover the data without manual retyping.
Best image types for Excel table extraction
The best results usually come from images where the table is clear, flat, and readable. The converter needs enough visual information to understand both the text and the grid.
Good candidates include:
- Clear screenshots of tables from apps, dashboards, websites, or PDF viewers
- JPG or PNG photos of printed tables
- Scanned invoices and delivery orders
- Inventory count sheets with SKU, location, and quantity columns
- Bank statement tables with dates, remarks, withdrawals, deposits, and balances
- Product price lists with item names, origin, prices, and totals
- Engineering BOM or parts lists with part numbers, quantities, materials, and descriptions
Images are harder to convert when they are blurry, tilted, compressed, handwritten, or photographed from a steep angle. OCR can still help, but you should expect to review the result more carefully.
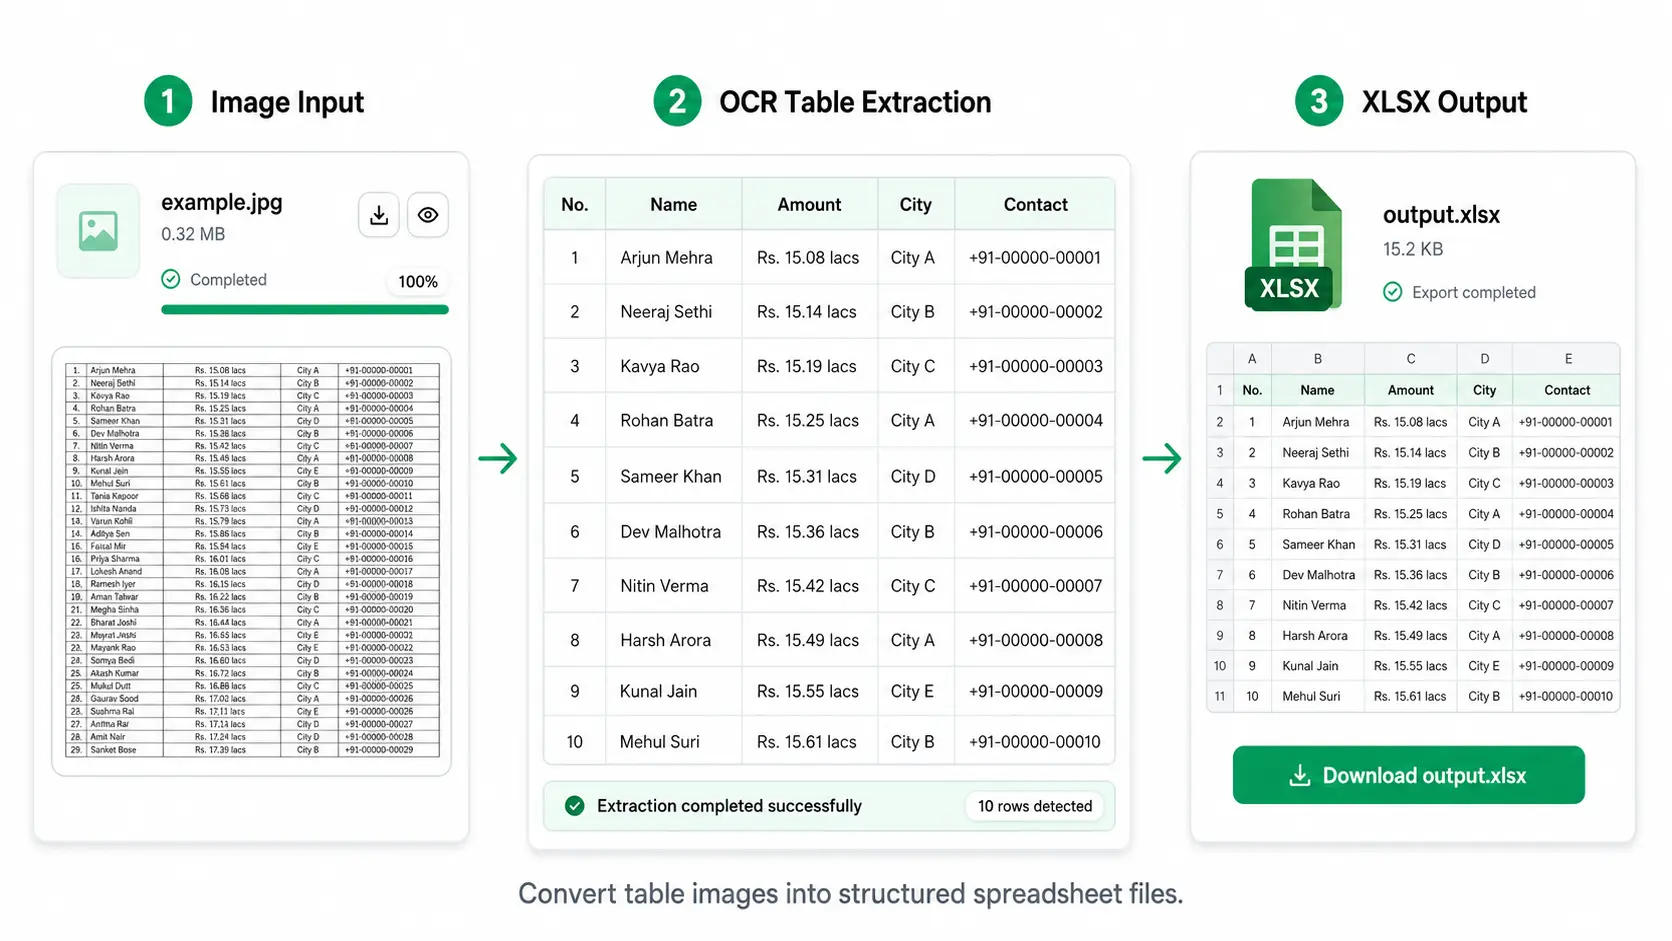
How to convert an image to an Excel table online
The process is simple, but each step matters if you want a clean spreadsheet.
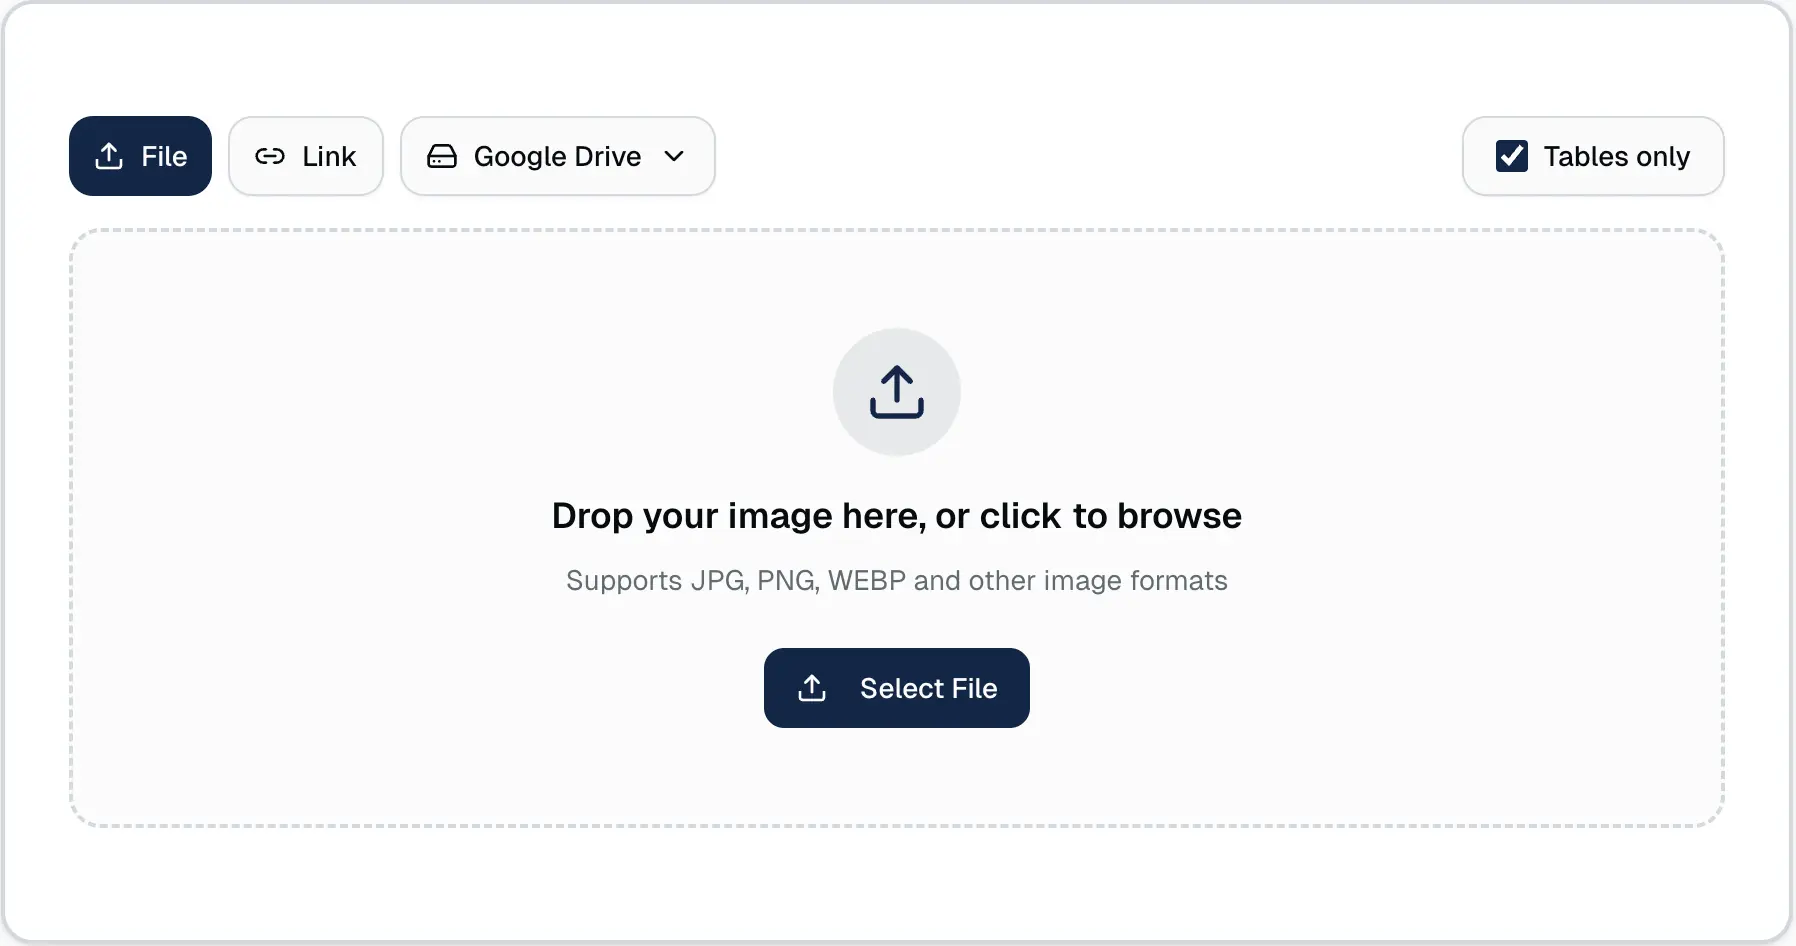
1. Upload the image
Start with a JPG, PNG, photo, screenshot, or scanned table image. If the table came from a phone camera, crop the image so the table fills most of the frame. If it came from a chat app, try to upload the original file instead of a heavily compressed preview.
2. Let OCR detect the table
OCR analyzes the image and looks for text, numbers, lines, headers, and cell boundaries. For table images, structure matters as much as text. The converter needs to identify which values belong in the same row and which values belong under the same column.
For example, in an inventory sheet, the OCR process should keep:
- SKU values under the SKU column
- Warehouse locations under the location column
- Hand-entered counts under the count column
- Row numbers aligned with the right product
3. Preview the extracted table
Before downloading, review the preview. This is where you can catch obvious problems:
- A header was split into two columns
- Two columns were merged by mistake
- A decimal point was missed
- A date was read incorrectly
- A handwritten mark was captured as a number
OCR saves time, but it should not be treated as a final record without review, especially for financial, legal, inventory, or identity-related documents.
4. Download Excel or XLSX
After previewing the data, download the result as an Excel XLSX file. The spreadsheet can be edited like a normal workbook: adjust column widths, rename headers, filter rows, add formulas, remove extra rows, and clean inconsistent values.
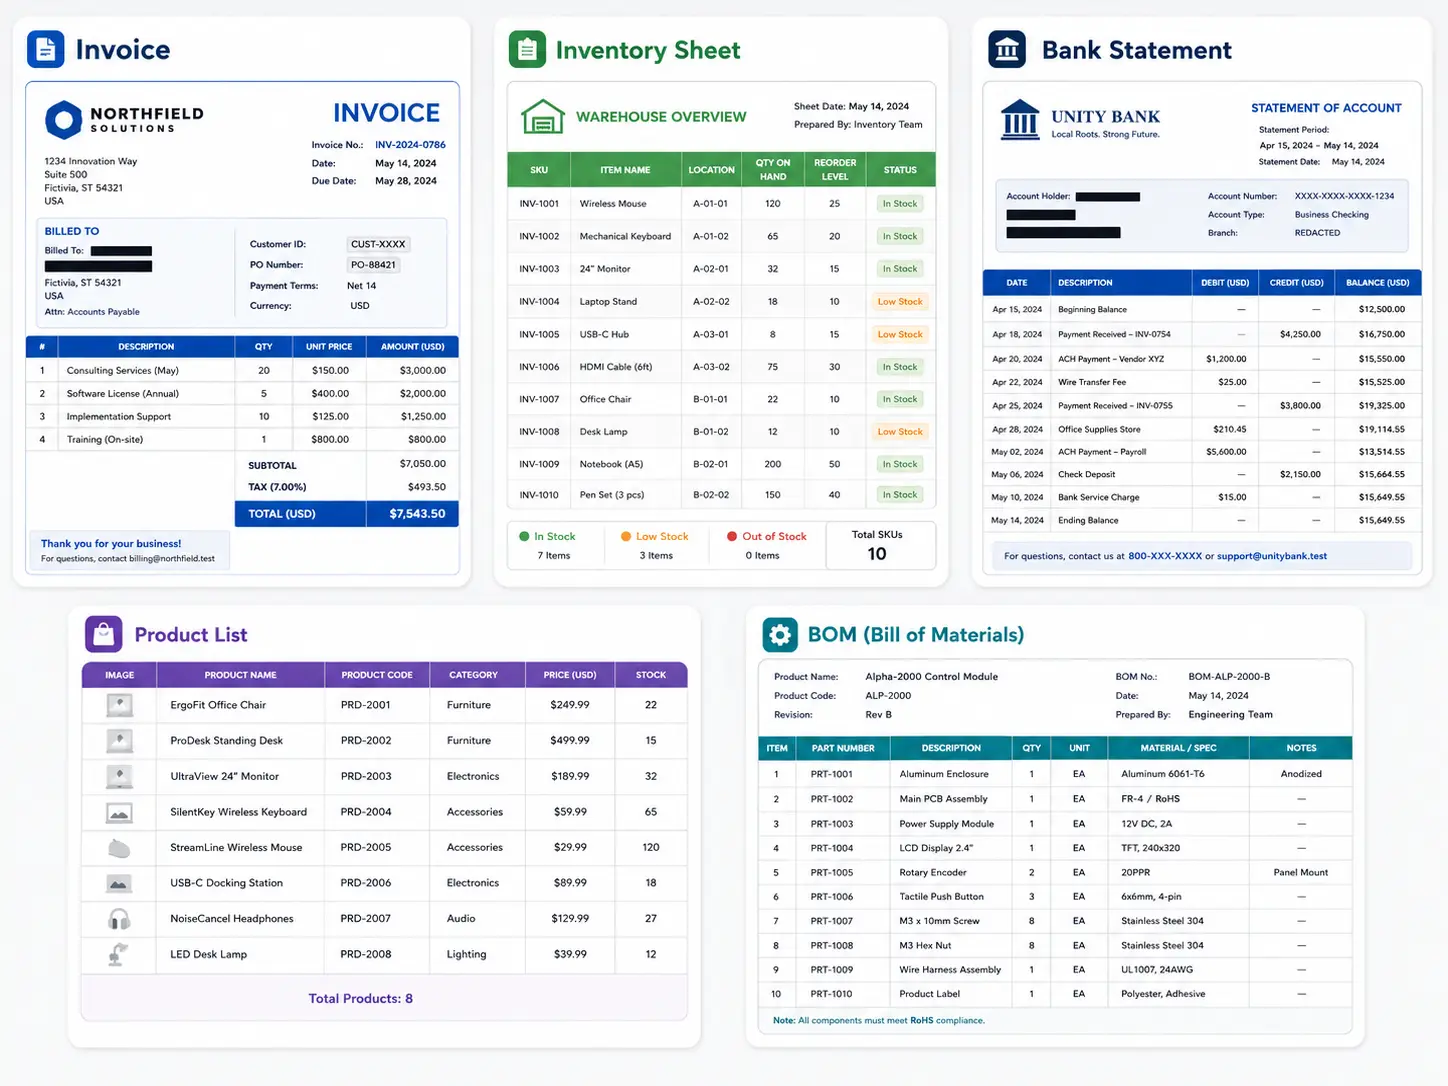
Real-world examples
Image-to-Excel conversion is most valuable when the table is part of a real workflow. Here are common examples based on the kinds of documents people actually upload.
Invoice or delivery order to Excel
Invoices and delivery orders often contain line-item tables. These tables may include product codes, barcodes, descriptions, quantities, unit prices, selling prices, and total amounts.
When converting this type of image, pay close attention to:
- Currency symbols and decimals
- Quantity columns
- Product descriptions that wrap onto two lines
- Totals and subtotals
- Page numbers in multi-page documents
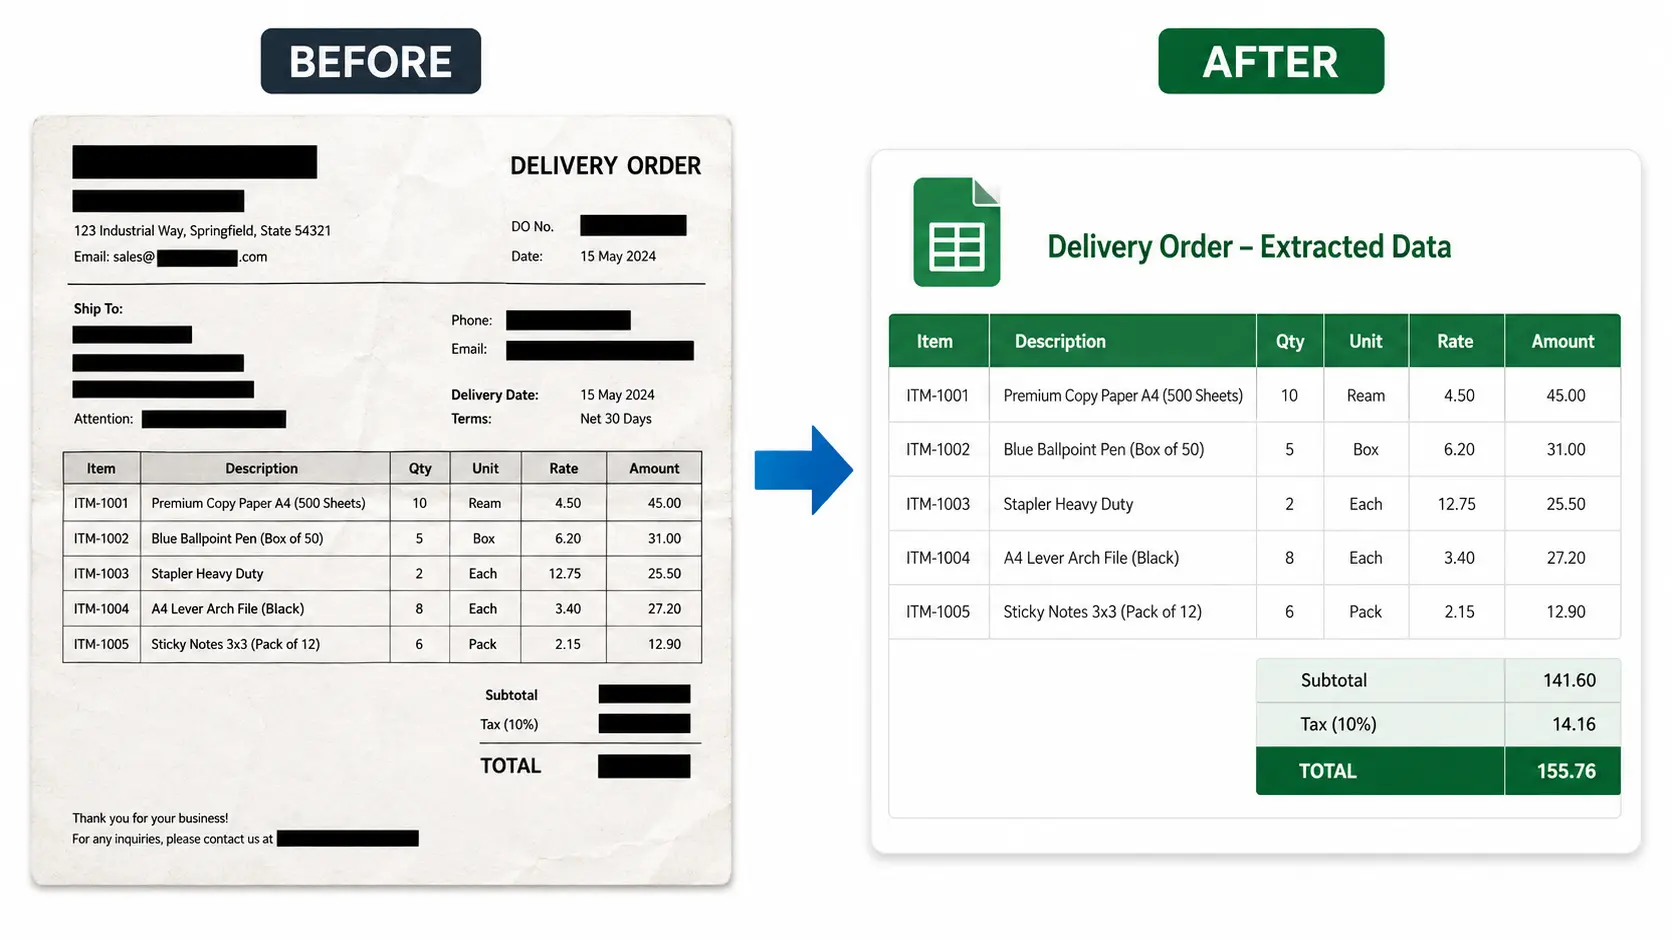
This use case is a strong fit for OCR because the table structure is usually clear, even if the document is scanned or photographed.
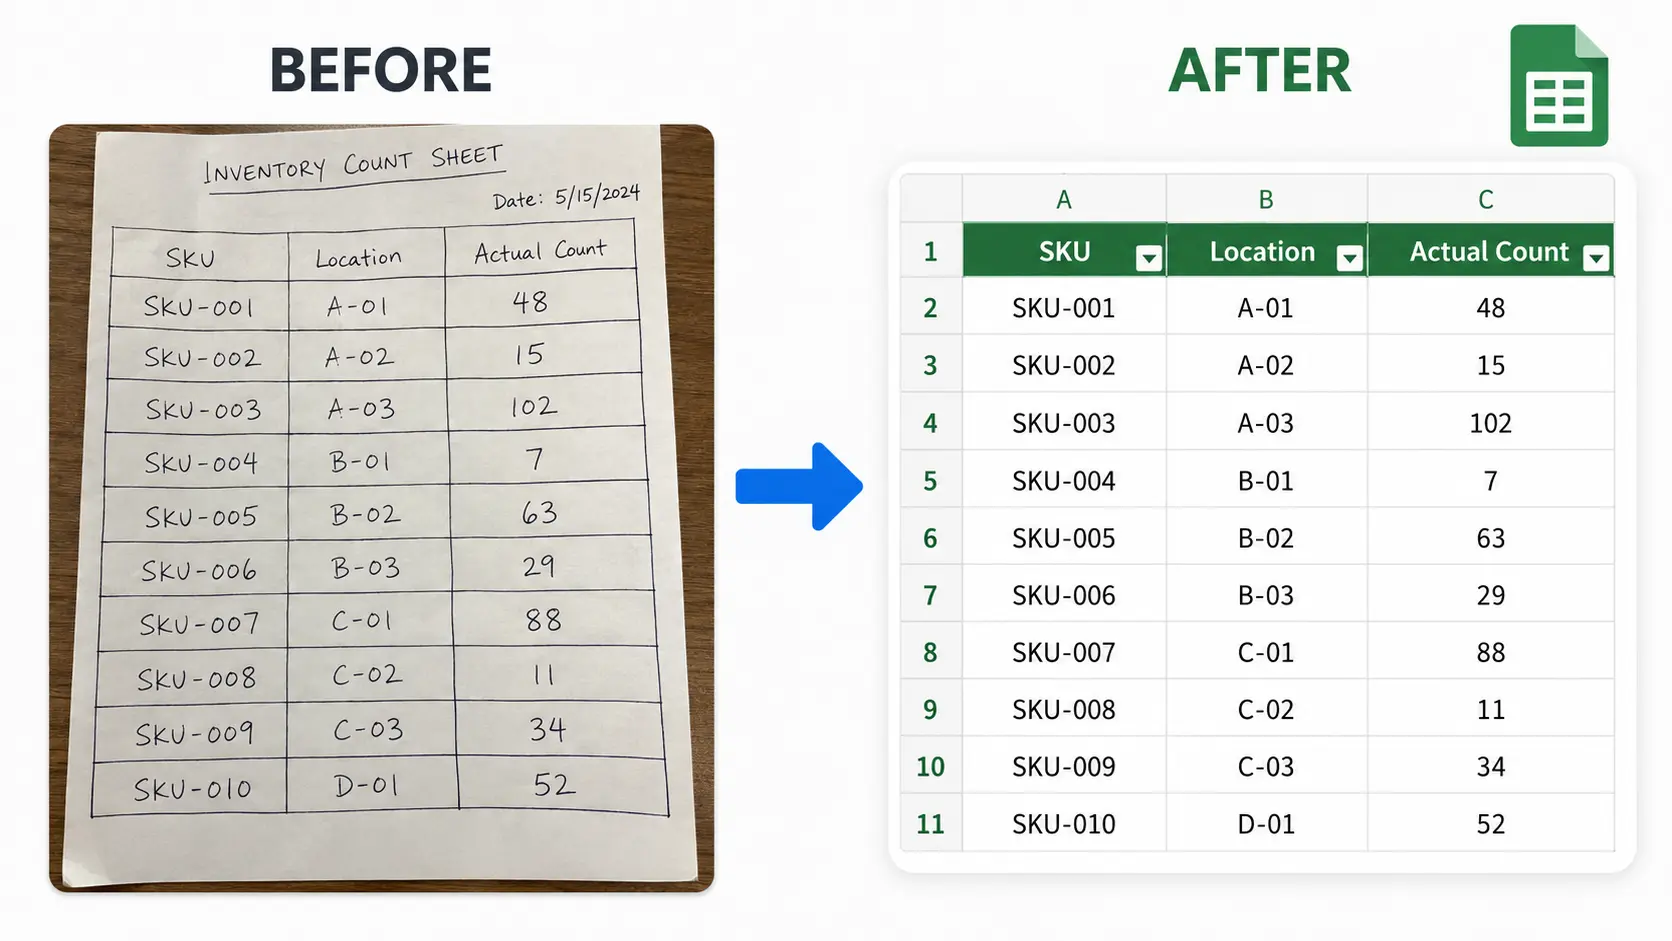
Inventory count sheet to Excel
Inventory sheets are another common source. A warehouse or retail team might write or circle actual counts on a printed table, then need to compare those values in Excel.
Typical columns include:
- No.
- SKU
- Location
- Actual count
- Notes
The challenge is that counts may be handwritten, circled, crossed out, or placed close to grid lines. OCR can extract printed columns reliably, but handwritten corrections should always be checked manually.
Bank statement image to Excel
Bank statements usually have consistent columns, but the data is sensitive and must be handled carefully. A statement image might contain transaction dates, remarks, withdrawal amounts, deposit amounts, and balances.
After conversion, review:
- Dates
- Transaction descriptions
- Debit and credit columns
- Balance values
- Decimal points
- Row order across pages
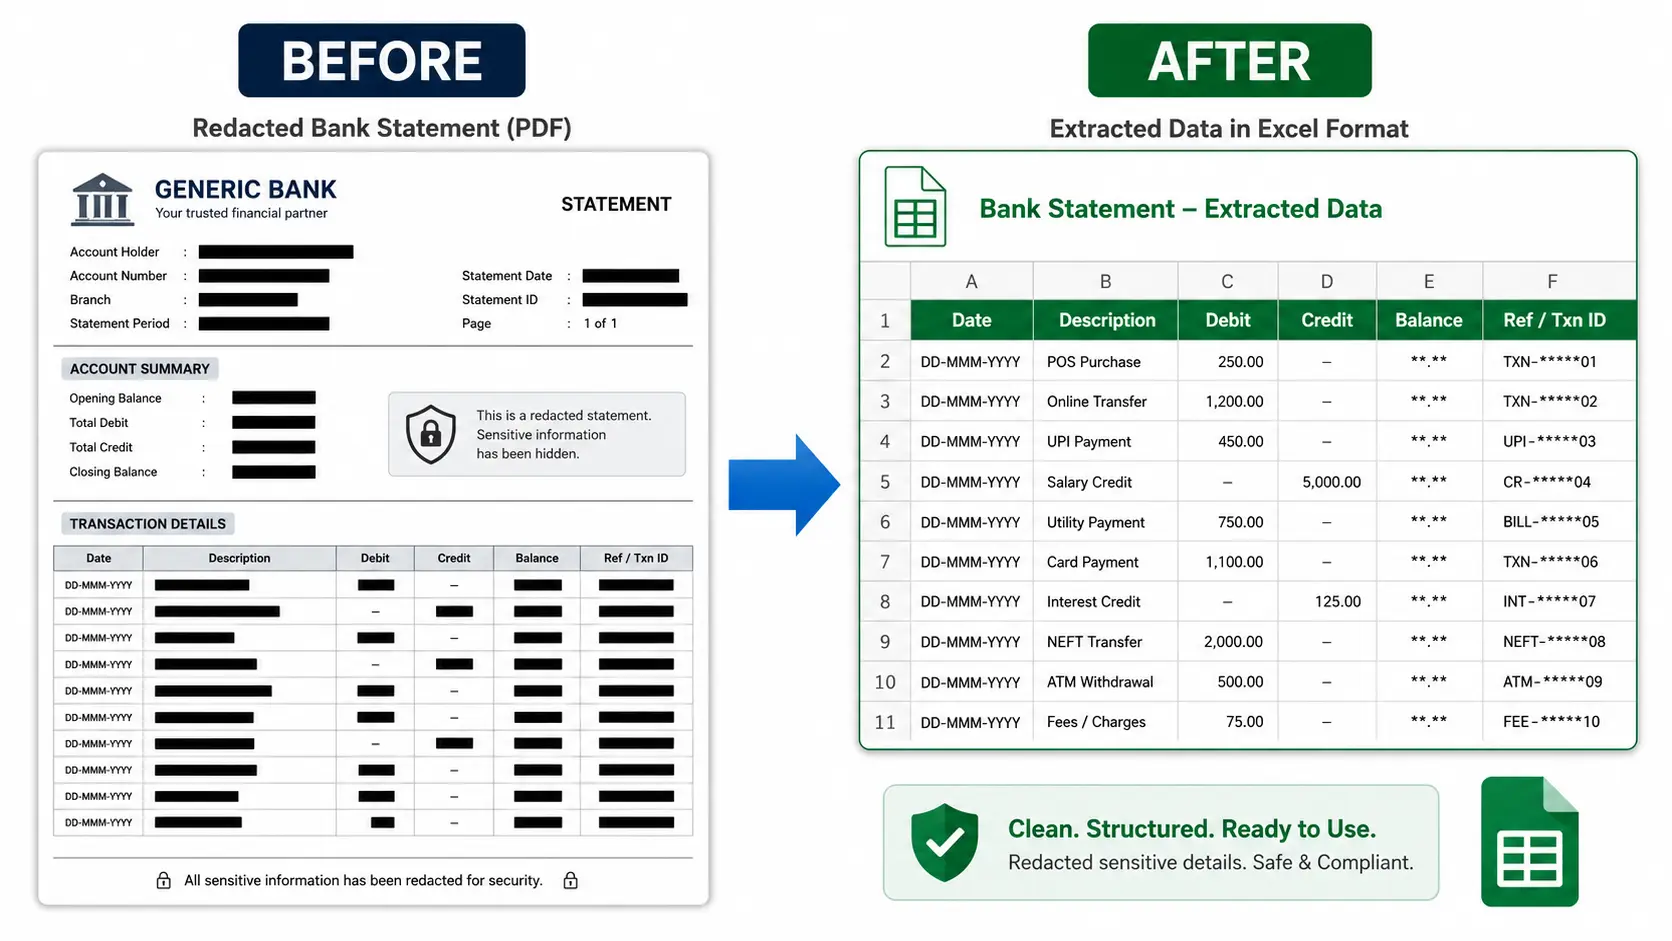
Do not publish or share real bank statement images without redacting names, account numbers, transaction IDs, and balances. If you need example images for a public article, use simulated data or heavily masked screenshots.
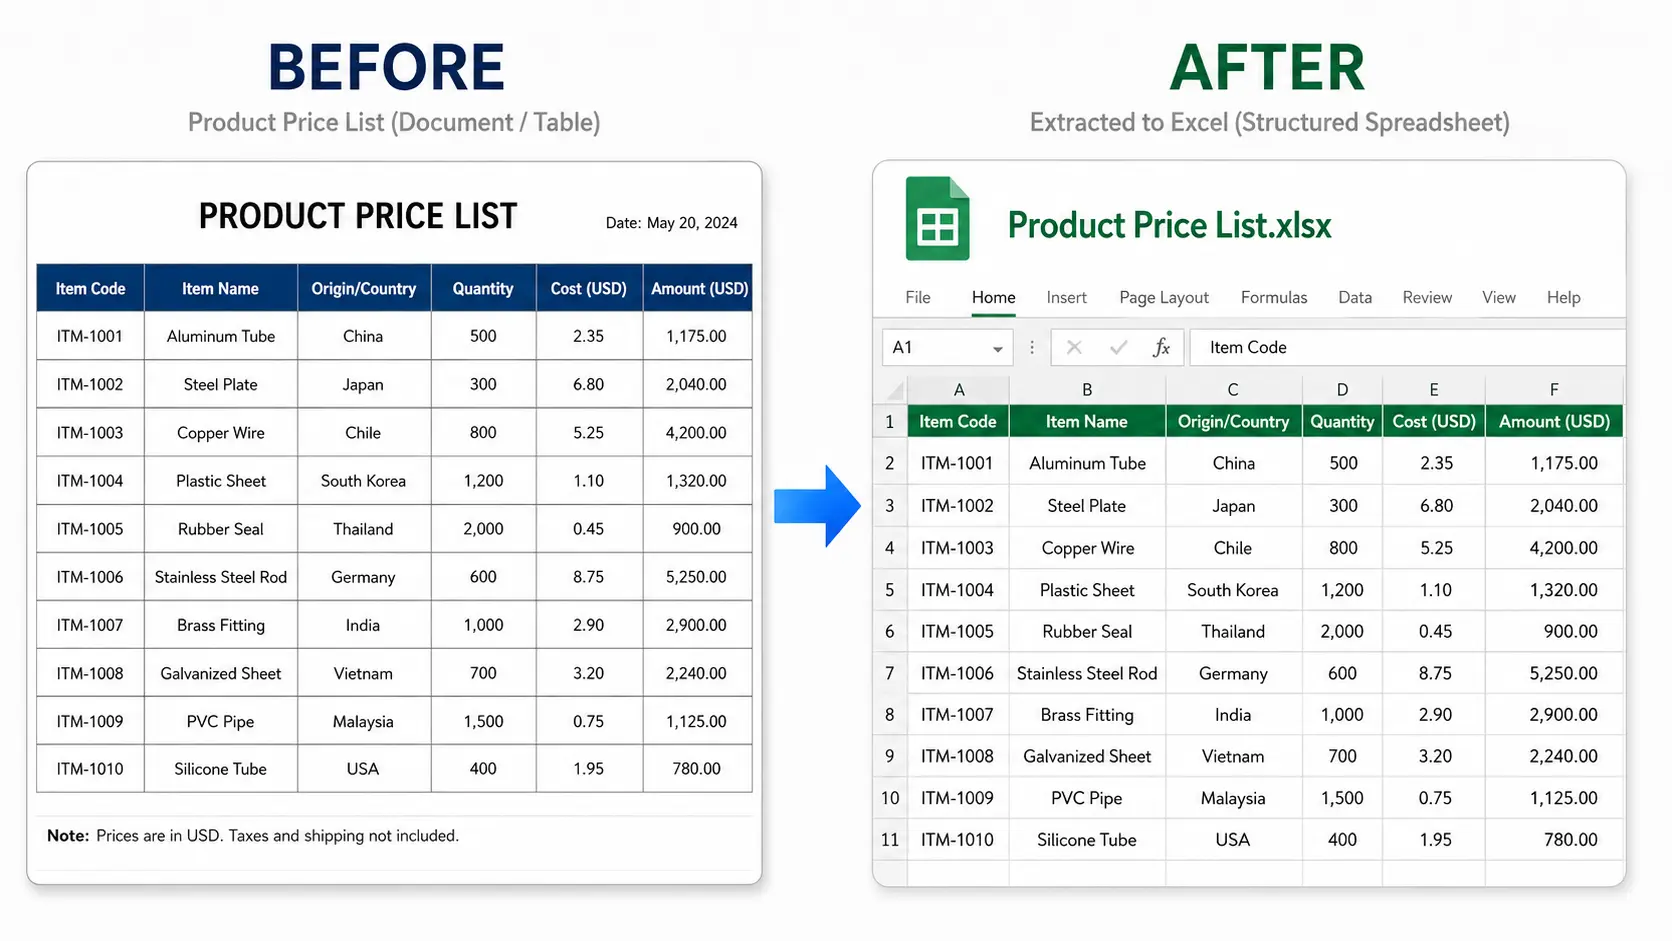
Product price list to Excel
Product lists and price sheets often come as screenshots or PDF exports. These tables may include product names, quantities, origin countries, codes, unit costs, and totals.
The main issue is width. Long product descriptions can make the table wide, and OCR may struggle if the image is too small. Use a high-resolution screenshot when possible.
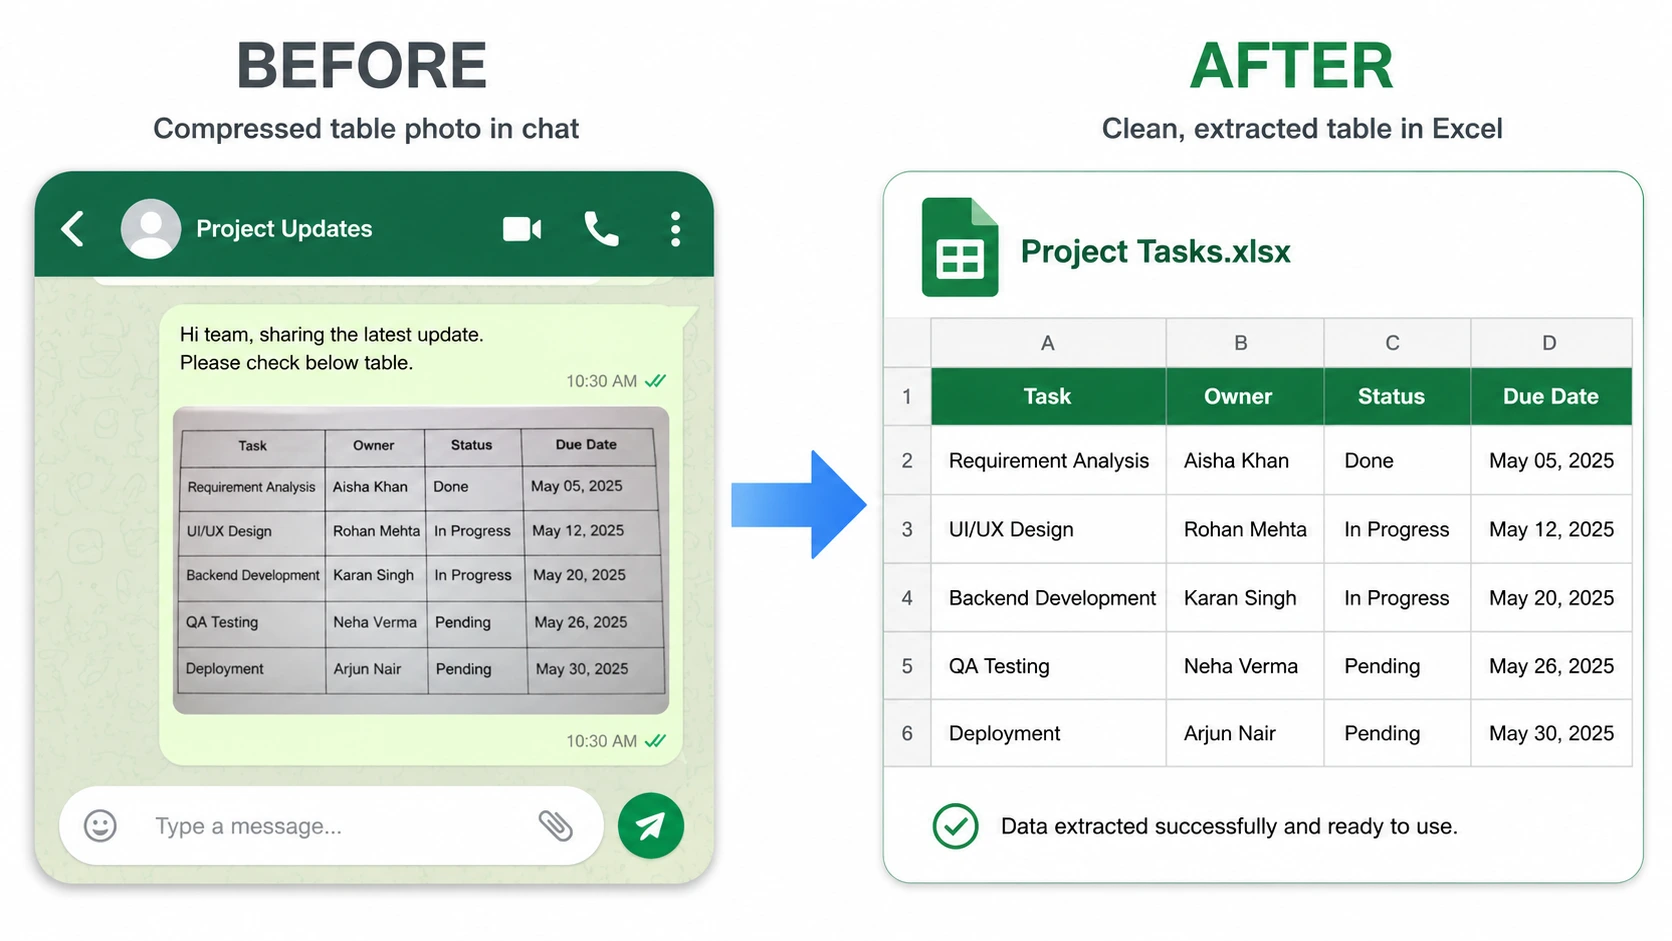
WhatsApp table photo to Excel
Many table photos are shared through WhatsApp or other messaging apps. These images can be compressed, resized, rotated, or renamed before they reach you.
For better results:
- Ask for the original image if possible
- Avoid screenshots of screenshots
- Crop away chat UI and blank margins
- Retake photos that are too blurry
- Keep the paper flat and the text horizontal
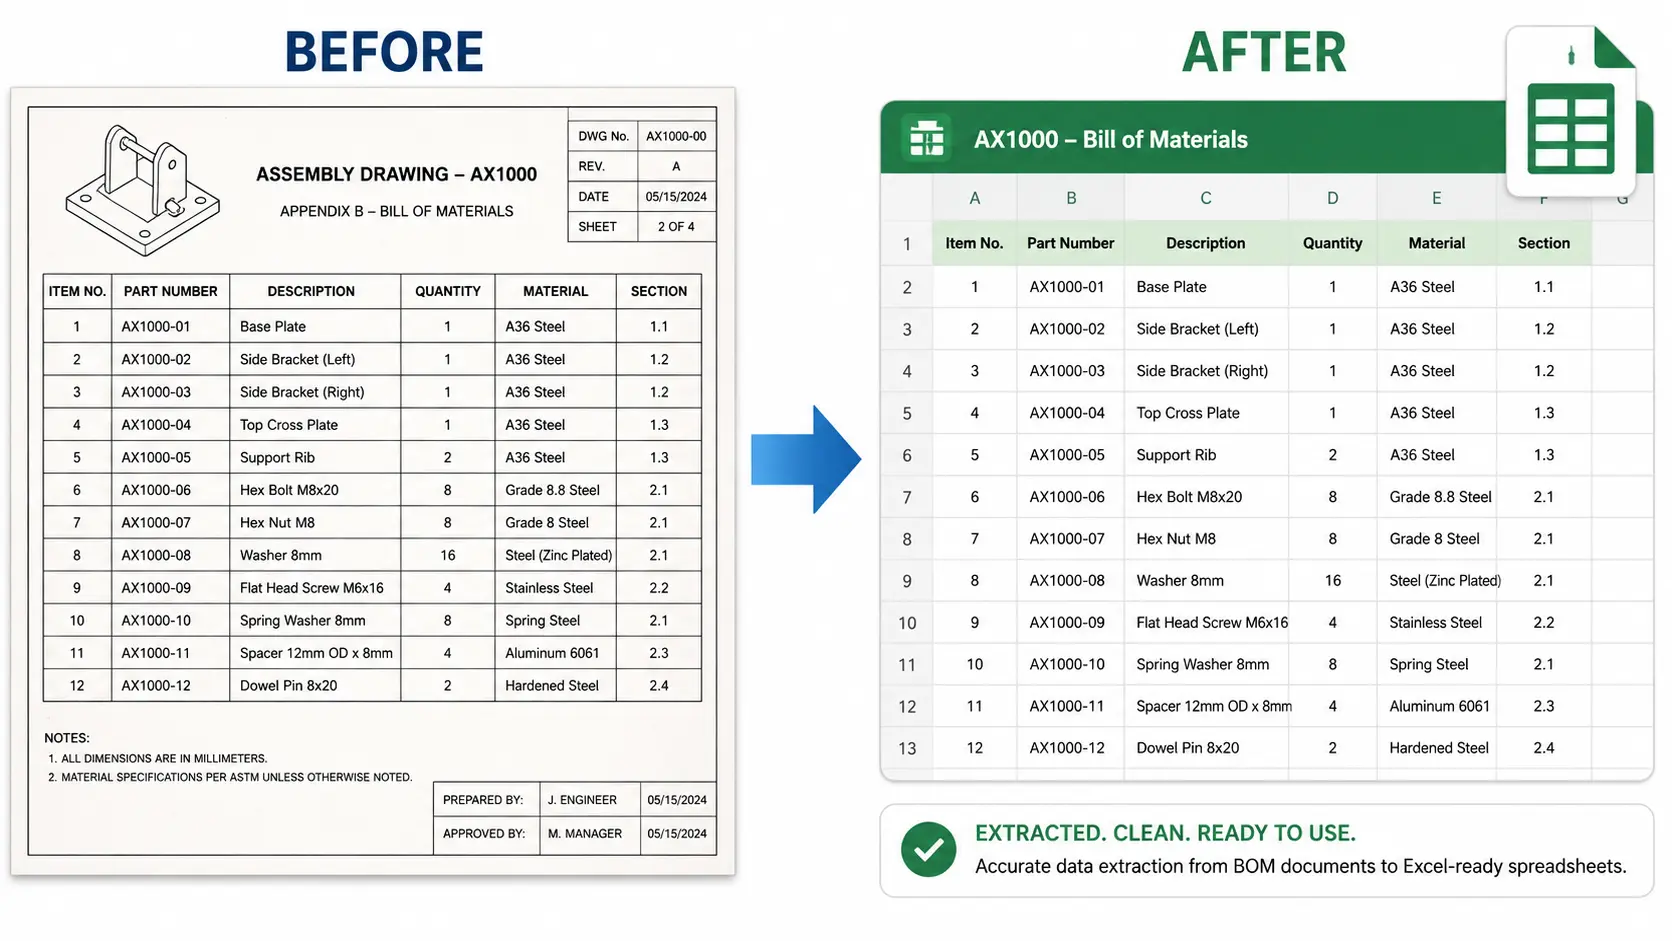
Engineering BOM or parts list to Excel
Engineering and procurement teams often need to extract parts lists from drawings, technical scans, or BOM screenshots. These tables may include part numbers, descriptions, materials, quantities, and section references.
For BOM images, verify every part number after conversion. A single character mistake can change the meaning of a component code.
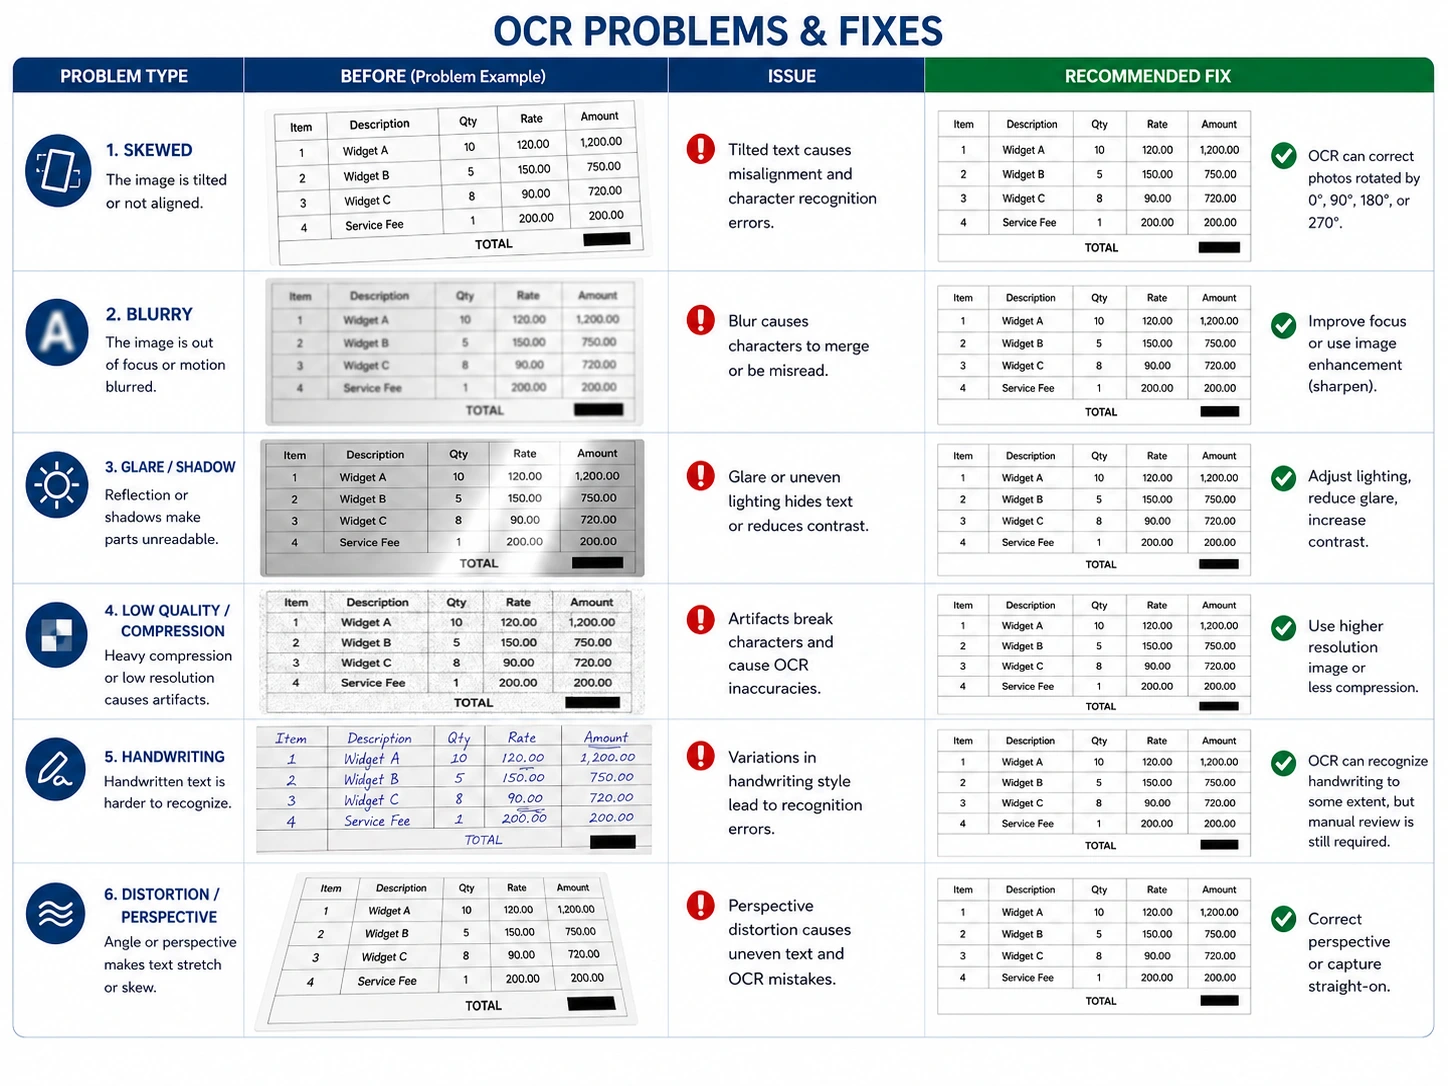
Common OCR problems and how to fix them
OCR quality depends heavily on the source image. Most problems are predictable and can be reduced before uploading.
The image is rotated sideways
If the document is sideways, rotate it before upload. OCR can sometimes detect orientation, but a correctly oriented image improves row and column detection.
The photo is skewed
Photos taken from an angle can make rows look narrower on one side than the other. Retake the image from directly above the table or use a scan app that corrects perspective.
Numbers are blurry
Small or blurry numbers are a common cause of mistakes. Move closer, use better lighting, or upload a higher-resolution screenshot.
Grid lines are faint
If grid lines are very light, OCR may still extract text but may not infer the correct columns. In that case, review the preview carefully and fix column alignment in Excel.
WhatsApp compressed the image
Compressed chat images often lose the details needed for accurate OCR. Use the original camera photo or a direct file upload when possible.
Handwritten notes overlap cells
Handwriting is harder than printed text. If handwritten notes are not part of the final spreadsheet, crop them out. If they are part of the data, review those cells manually after conversion.
What the Excel output can and cannot preserve
An image-to-Excel converter focuses on table data and structure. It is designed to create a useful spreadsheet, not a pixel-perfect copy of the original image.
It can usually preserve:
- Rows and columns
- Header text
- Cell values
- Numeric data
- Dates and IDs
- Basic table order
It may not perfectly preserve:
- Fonts
- Exact colors
- Complex borders
- Merged cells
- Wrapped multi-line headers
- Logos and signatures
- Page layout
- Handwritten corrections
For most business workflows, this is the right tradeoff. The goal is to recover editable data so you can clean, calculate, filter, reconcile, or share it.
Privacy checklist before uploading documents
Many table images contain sensitive information. Before uploading a document to any online OCR tool, check whether it includes:
- Personal names
- Phone numbers
- Addresses
- Bank account details
- Transaction IDs
- Customer records
- Identity numbers
- Payroll data
- Confidential product prices
- Internal business notes
If the file is sensitive, make sure you are comfortable processing it online. For public examples, never use raw customer uploads. Redact the data, crop unnecessary fields, or recreate the table with sample values.
FAQ
Can I convert a JPG image to an Excel table?
Yes. If the JPG contains a readable table, OCR can extract the rows and columns and export them as an editable Excel XLSX file.
Can OCR extract tables from screenshots?
Yes. Screenshots often work well because text and grid lines are usually sharper than in camera photos. High-resolution screenshots are best for dense tables.
Can I convert a scanned table to Excel?
Yes. Scanned tables can be converted when the scan is clear, straight, and high enough resolution. Cropping to the table area usually improves results.
Will the Excel file keep the same rows and columns?
The converter attempts to preserve the table structure, including rows, columns, and headers. Complex layouts, merged cells, or faint grid lines may need cleanup after export.
Why did OCR miss some numbers?
Numbers are often missed when the image is blurry, compressed, tilted, too small, or covered by glare or handwriting. Retaking the image or uploading a sharper screenshot can improve accuracy.
Is image to Excel table conversion accurate enough for accounting?
It can speed up data entry, but OCR output should be reviewed before accounting, tax, legal, or operational use. Always check amounts, dates, IDs, totals, and formulas.
Try converting your table image
If you have a JPG, PNG, photo, screenshot, or scanned table image, upload it to the JPG to Excel converter and download an editable XLSX file. Start with a clear image, preview the extracted table, and review important values before using the spreadsheet in real work.